Vidhya Thyagarajan, Kartik Kariya, Sreeja Menon
Rambus Inc.
{vidhya, kkariya, smenon}@rambus.com
Abstract :
The memory-subsystem includes a memory device such as DRAM, memory controller and physical/IO layer (PHY). There are several parameters that affect the performance of the memory subsystem, including DRAM timing parameters such as read latency, read-write turn-around delays, low-power state exit and entry latencies, Memory Controller resources and features such as queue depth and organization, reordering policies and Memory PHY layer properties such as transmit and receive latencies. In this paper, we outline the various parameters that affect the memory sub-system performance and also introduce the Sensitivity Analysis and Feature Exploration methodologies to analyze the degree of impact of each of these parameters. This platform, when used at an early architectural exploration phase, provides valuable feedback to the memory device, controller and PHY architects to focus on optimizing the most critical parameters. We present a case-study to analyze a next generation mobile DRAM based memory sub-system using our proposed performance architectural exploration platform, and provide a ranking metric for all the parameters that affect the memory sub-system performance for key mobile applications.
1. INTRODUCTION
Figure 1 shows an example mobile phone system including the memory sub-system. The memory sub-system consists of a memory controller, a physical/IO layer (PHY) and a memory device, such as DRAM or Flash. The memory sub-system performance is one of the key factors affecting the overall system performance [1].
The performance of a memory sub-system is measured by the bandwidth, latency and power consumed as seen by the system. This is determined both by the memory sub-system properties as well as the application properties [2] [3] [4].

Fig 1: Memory Sub-System in a mobile phone
Performance analysis can be done at various stages such as after hardware and software is integrated during bring up. The importance of an early performance analysis such as at the chip level verification stage or at the memory controller tuning stage has been highlighted under memory and non-memory context by various studies [5] [6]. However, even this is typically too late to make fundamental architectural changes to the design. In this paper, we propose a platform and methodology for integrating performance analysis with early architectural exploration. This can generate valuable feedback to various logic and circuit architects to focus the optimization efforts with high return on investment.
In this paper we make the following contributions:
- Define the various memory sub-system parameters that affect the system level performance such as memory bandwidth, latency and power
- Define a performance analysis frame-work and two methodologies namely, sensitivity analysis and feature exploration that allow to measure and rank the performance impact of the various parameters.
- Demonstrate the results and architectural feedback for a next generation mobile DRAM based solution.
The rest of the paper is organized as follows:
Section 2 describes the various parameters that affect the memory subsystem performance
Section 3 describes the performance architecture exploration platform setup and sample mobile application profiles.
Section 4 describes our sensitivity analysis and feature exploration methodologies and results from analyzing a next-generation mobile DRAM based system
2. MEMORY SUB-SYSTEM PERFORMANCE PARAMETERES
2.1 Overview
The impact of the various system parameters on performance and power of the memory sub system are studied for architectural exploration. This section defines the lists of performance parameters which are evaluated during early architecture development phase.
2.2 Memory Controller Performance Parameters
Figure 2 shows the architectural overview of a memory controller interfacing with the mobile memory PHY and DRAM. The memory controller is a multi-port controller having a number of configurable features. The memory controller interfaces with the mobile memory PHY on one side and has a user interface such as AXI, AHB, OCP on the other side. The controller receives the user interface compliant requests from the agents connected to its ports and converts those into the memory protocol compliant request packets. Similarly, the read data obtained from memory is converted into user interface compliant response packets by the controller. The memory controller implements a variety of features such as Application Interfaces (AXI, AHB, OCP), Queue Depth options, Command grouping based on Read-Writes/Page-Hits, High Priority Request Scheduling, Page Policies and Power Management policies.
Table 1 provides the comprehensive list of memory controller parameters recommended for performing the architectural exploration. These parameters impact performance factors such as bandwidth, latency and power of the memory sub system and thus provide key feedback in the architecture phase for possible optimizations and feature enhancements.

Fig 2: Mobile Memory Controller Architecture
2.3 PHY and DRAM Performance Parameters
As depicted in Figure 1, in addition to the memory controller, memory PHY and DRAM are the other key components of the memory sub system. The architecture exploration aims at providing important data on the effect of the PHY and DRAM parameters on the various performance and power aspects of the system. The data obtained from the studies can be used to optimize important parameters during PHY architecture and also helps to select appropriate DRAM device.
Table 2 provides the list of PHY and DRAM parameters recommended in this paper for performance evaluation. Some of the parameters under study are a net result of a number of sub parameters and hence studying the impact of one parameter would give feedback on performance impact of a number of sub-parameters.
3. EXPERIMENTAL SETUP FOR ARCHITECTURE EXPLORATION
A generic architecture exploration platform, to study the various performance parameters of the memory sub-system is shown in Figure 3. A low power mobile memory subsystem is used as a case study to demonstrate the performance evaluation methodology.
| MC Parameter | Description |
| Queue Depth | The internal request queue depth of the memory controller selected based on bandwidth and latency requirements |
| Page Management Policies | Page management policies determine when an accessed DRAM page would be closed - Open Page, Open Page with Timeout, Closed Page, Closed Page with look ahead, Adaptive Open Page |
| Reordering based on Page Hits | This parameter when enabled groups all page hits in each of memory controller queues resulting in re-ordering of requests. |
| High Priority Request Support | When this feature is enabled, the application agent can assign a request as “high priority” and is given priority over normal requests. |
| Read-Write Turnaround Threshold | This parameter enables the memory controller to group reads together and writes together in order to minimize the R-W and W-R turnarounds. |
| Bank Arbitration | This parameter controls the ordering of DRAM COL commands across various banks - Round robin, In Order |
| Refresh Policies | Refresh policies enables refresh to every row in each bank of the mobile DRAM as per the DRAM protocol - All bank refresh, Per bank refresh, Per bank out of order refresh |
| Power Management Policies | Power Management policies enable the various power states supported by the mobile memory sub-system - Clock Gating, Clock Stop, Power Down, Self-Refresh, Deep Power Down |
| Port Arbitration Policies | Port arbitration policies determine the order of processing the various ports of the multi-port controller - Round Robin, Weighted Round Robin, Strict Priority with Starvation Detection |
| Address Mapping | Address mapping translates the logical address of a user interface request to physical (memory) address |
Table 1 : Memory Controller Performance Parameters
Parameter
| Description & Associated Sub-Parameters (wherever applicable)
|
| Read-Write Turnaround | Time between read requests to write request at PHY-memory controller interface.
tΔRW (Turnaround) = (tCAC* - tCWD**)+ tCC*** + tRW-BUB****
|
| Read Latency | Time from read command to read data on the PHY-memory controller interface.
Read Latency = tCAC+ internal PHY propagation delays + roundtrip-channel-delay
|
Write Latency
| Time from write command to write data on PHY-memory controller interface.
This parameter is equivalent to tCWD
|
| Power Down Entry Latency | Entry latency for going to a power down mode.
Separate Parameter for each unique low power mode
|
Power Down Exit Latency
| Exit latency to exit from a power down mode
Separate parameter for each unique low power mode.
|
Row-Column Access DRAM Timing Parameters
| Row, Column operation related timing parameters for DRAM such as tRC (interval between two successive ACT commands), tRCD-R (row-to-column-read delay), tRCD-W(row-to-column write delay) etc.
|
Refresh mode timing parameters
| Refresh operation related timing parameters for DRAM such as auto-refresh cycle time for all banks, average interval between successive auto-refresh commands
|
Data path timing related PHY parameters
| Data path timing related parameters for PHY
Timing parameters such as tTET (time from assertion of TXEN to actual transmit data on PHY-memory controller interface)
|
*tCAC is the time from RD command to RD data for DRAM
**tCWD is the Write Command to Write Data delay for DRAM
***tCC is the Column cycle timing for DRAM
****tRW-BUB is the PHY propagation delay
Table 2: PHY and DRAM Performance Parameters
A SystemC model of a multi-port memory controller interfacing with a PHY and low power DRAM (mobile platform memory) is used as the core of the set up. The memory sub-system model implements all the functionalities as described in Section 2. Traffic generators initiate test patterns to the multi-port memory controller compliant with the user interface protocol such as AXI/AHB/OCP supported by the memory controller. A performance analyzer is used to record the transactions and generate the performance and power statistics.

Fig 3: Performance Architecture Exploration Set Up
3.1 Application Profiles
A smart phone application based traffic profiles are used in the experimental set up. Table 3 depicts the characteristics of the profile with a target system bandwidth of 6.4GB/s.
4. PERFORMANCE ANALYSIS AND RESULT EVALUATION METHODOLOGY
This section illustrates our proposed methodology for performing architecture exploration and studying the impact of various system parameters on performance using the platform described in Section 3. Subsequent sections also illustrate the methodology for evaluating the results aiding in providing early architectural feedback using a next generation mobile platform as case study.
4.1 Sensitivity Analysis
We introduce Sensitivity Analysis methodology in this paper to study the performance impact of system parameters which can vary within a range of values. The “Sensitivity” of a parameter is defined as the amount of variation of a performance factor (such as bandwidth, power, and latency) for unit variation of the parameter under analysis. The parameters are varied through a range of values and the impact on performance in terms of sensitivity is studied.
Sensitivity analysis provides following advantages to architectural phase.
| Profile Name | Comparable Use Case | Characteristics |
| Low Load | Handset voice/data, display update | 32Byte burst every 200ns
64Byte burst every 500ns
128Byte burst every 1us
512Byte burst every 5us
Read-Write Ratio= 80/20
Page Hit-Miss Ratio=50/50
Target Bandwidth = ~100 -150MByte/s
|
| Medium Load | Handset voice/hi-speed data, video playback, imaging | 32Byte burst every 30ns
64Byte burst every 50ns
128Byte burst every 200ns
256Byte burst every 400ns
Read-Write Ratio= 70/30
Page Hit-Miss Ratio=50/50
Target Bandwidth= ~1GByte/s
|
| Heavy Load | Very High utilization, use can be arbitrary | 128Byte burst every 20ns
256Byte burst every 40ns
512Byte burst every 80ns
1024Byte burst every 160ns
Read-Write Ratio= 60/40
Page Hit-Miss Ratio=50/50
Target Bandwidth= 6.4GByte/s
|
Table 3: Traffic Profile in Experimental Set Up
1. Provides feedback on the useful range of values for system parameters in order to provide optimum performance (suitable for DRAM and PHY timing parameters)
2. Provides a ranking matrix for all the system parameters by measuring the relative impact of each of them on performance (measured through the Sensitivity Metric). This process helps in identifying critical system parameters which have a higher impact on performance and hence are the most suitable candidates for further optimization during architecture/design stages.
Sensitivity analysis in our experimental set up is performed using the 3 different application profiles described in Table 3. An example illustration of results and evaluation methodology of the system parameters described in Section 2 is presented below.
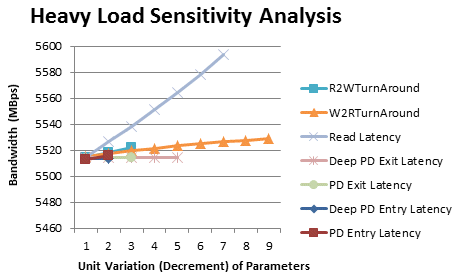
Sensitivity analysis methodology evaluates the variations of a performance factor (such as bandwidth) as the system parameters are stepped through a range of values. Figure 4 shows an example result in which the bandwidth is measured in MBps for each unit variation (decrement) of R-W Turnaround, W-R Turnaround, Read Latency and Power Down entry/exit latencies, under the heavy load traffic profile. The slope of the plots indicates the impact of each unit of parameter variation on the system performance and thereby serves as sensitivity metric. For example, the slope of the power down exit latency curve is low, indicating that improving the power down exit latencies has a relatively smaller effect on bandwidth, while read latency curve that has a higher slope, indicates that the read latency parameter has a very high impact.

Fig 4: Sensitivity Analysis of Heavy Load Profile
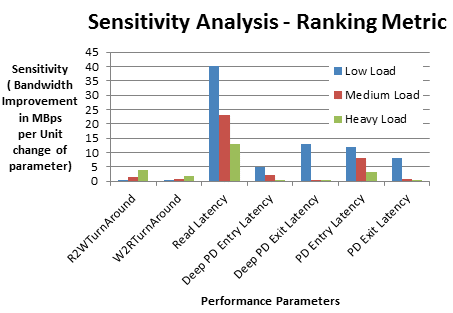
Similar analysis was conducted for the Low Load and Medium Load traffic profiles of Table 3 and analysis plots similar to Figure 4 were obtained. The sensitivity (slopes) for various system parameters for the three traffic profiles were plotted on Y-axis in Figure 5. For example, Read Latency curve in Figure 4 indicates that for every 1 unit decrement of Read Latency, Bandwidth improves by 13MBps. Hence, the sensitivity (slope) for Read Latency under Heavy Load is obtained as 13MBps per unit decrement of latency value which is plotted in Figure 5.
The process of plotting slope of each of the system parameter was performed and a consolidated ranking metric as shown in Figure 5 was obtained. This graph thus provides information on the relative impact of various parameters on the system performance.
Some of the conclusions which can be derived from Figure 5 are as follows.
1. Read Latency has the maximum impact on bandwidth among the parameters studied.
2. As the traffic load decreases, the effect of read latency increases.
3. As the traffic load increases, the effect of parameters such as R-W turnaround and W-R turnaround increases.
4. As the traffic load decreases, the effect of power down entry/exit latencies increases

Fig 5 : Sensitivity Analysis Ranking Metric
From the above, an architect who is selecting a DRAM device, and wishes to derive the maximum bandwidth at low load conditions, can for example, select a device which has a smaller read latency as opposed to one which has a smaller power down entry/exit latency.
The parameters under study could be a net result of a number of sub parameters. For example, R-W turnaround (tΔRW) which is defined as the time from a read request to a write request at the PHY-memory controller interface follows an equation as given below (also described in Table 2).
tΔRW = (tCAC - tCWD)+ tCC + tRW-BUB
By studying the impact of tΔRW, architects can further tune the sub-parameters of the above equation (which include DRAM parameters as well as internal PHY parameters) in order to provide a performance improvement.
4.2 Feature Exploration
In this section, the methodology to perform feature exploration by evaluating the impact of enabling a feature on performance factors such as bandwidth, latency and power is described. This analysis methodology helps in performing feature exploration during architectural stage and to select inclusion or exclusion of features of the memory sub-system as well as selection of parameter values associated with the features to achieve better performance.
For studying the feature exploration, the Heavy Load traffic profile described in Table 3 is used.
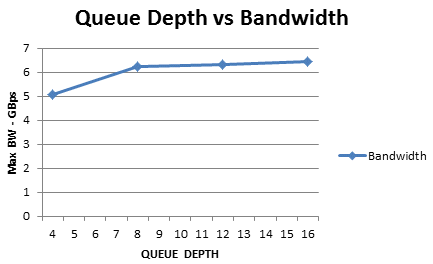
The feature exploration for studying the impact of memory controller queue depth as an example is depicted in Figure 6 and Figure 7. Figure 6 indicates that the actual bandwidth saturates beyond queue depth value of 8 and Figure 7 indicates that increase in queue depth causes increase in latency. As a result, the memory controller architect could decide to set the memory controller queue depth to 8 for optimum performance.

Figure 6 : Effect of Queue Depth on Bandwidth
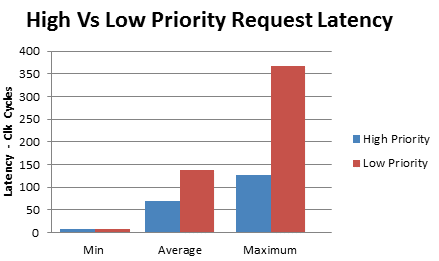
With the queue depth set to 8, the feature exploration can be continued further for studying the impact of other system parameters. Figure 8 illustrates an example result of impact of enabling High Priority Request feature of the memory controller. By enabling this feature, the traffic generator can assign selected requests as “high priority” which in turn are processed in priority over normal low priority requests. Figure 8 indicates that by enabling the high priority request processing, the average latency of the high priority requests get reduced to 60 clocks cycles and maximum latency to 125.
In turn, compared to the latency results for queue depth as 8 in Figure 6 (where High Priority Request processing is not enabled), the maximum latency of normal requests increases from 320 clocks in Figure 6 to 370 clocks in Figure 8 in order to process priority requests sooner. The average latency also increases from 120 to 140 clocks for normal requests.
Similar feature exploration analysis can be performed for all the system parameters described in Section2 to obtain information regarding the performance impact.
5 CONCLUSION
In this paper, we highlighted the importance of performance analysis at the architectural exploration phase. We defined the memory sub-system features and parameters that impact the system level performance metrics such as bandwidth, latency and power. Two performance evaluation methodologies namely Sensitivity Analysis and Feature Exploration were introduced in the paper to measure the impact of each performance parameter of interest. A generic performance modeling frame-work that can be used to simulate the variations in the parameters and to apply the two evaluation methodologies was proposed. We presented a case study of the architectural exploration of a next generation mobile-DRAM based system. Example results showing the application of our sensitivity analysis and feature exploration methodologies to sample mobile application profiles were demonstrated. We were able to rank and quantify the impact of various parameters on the system performance using the performance modeling framework and evaluation methodologies which in turn serve as priority guidelines for architectural optimizations.

Fig 7 : Effect of Queue Depth on Latency

Fig 8 : Effect of enabling High Priority Request
6 REFERENCES
[1] N Woo. High Performance SOC for Mobile Applications, IEEE Asian Solid-State Circuits Conference 2010 / Beijing, China
[2] S. Rixner, W. J. Dally, U. J. Kapasi, P. Mattson, and J. D. Owens. Memory access scheduling. In ISCA-27, 2000.
[3] R Iyer, L Zhao, F Guo, R Illikkal, S Makineni, D Newell, Y Solihin, L Hsu and S Reinhardt. QoS Policies and Architecture for Cache/Memory in CMP Platforms, SIGMETRICS ’07
[4] H Lee and E Chung. Scalable QoS-Aware Memory Controller for High-Bandwidth Packet Memory, IEEE Transactions on VLSI Systems, , MARCH 2008
[5] S Swaminathan, K. Yogendhar, V Thyagarajan. Re-usable Performance Verification of Interconnect IP Designs, DVCON 2007
[6] David Tawei Wang, “Modern DRAM memory systems: Performance analysis and a high performance, power-constrained DRAM scheduling algorithm”, Doctor of Philosophy Dissertation, University of Maryland, 2005