India Foundry Market Size 2025-2029
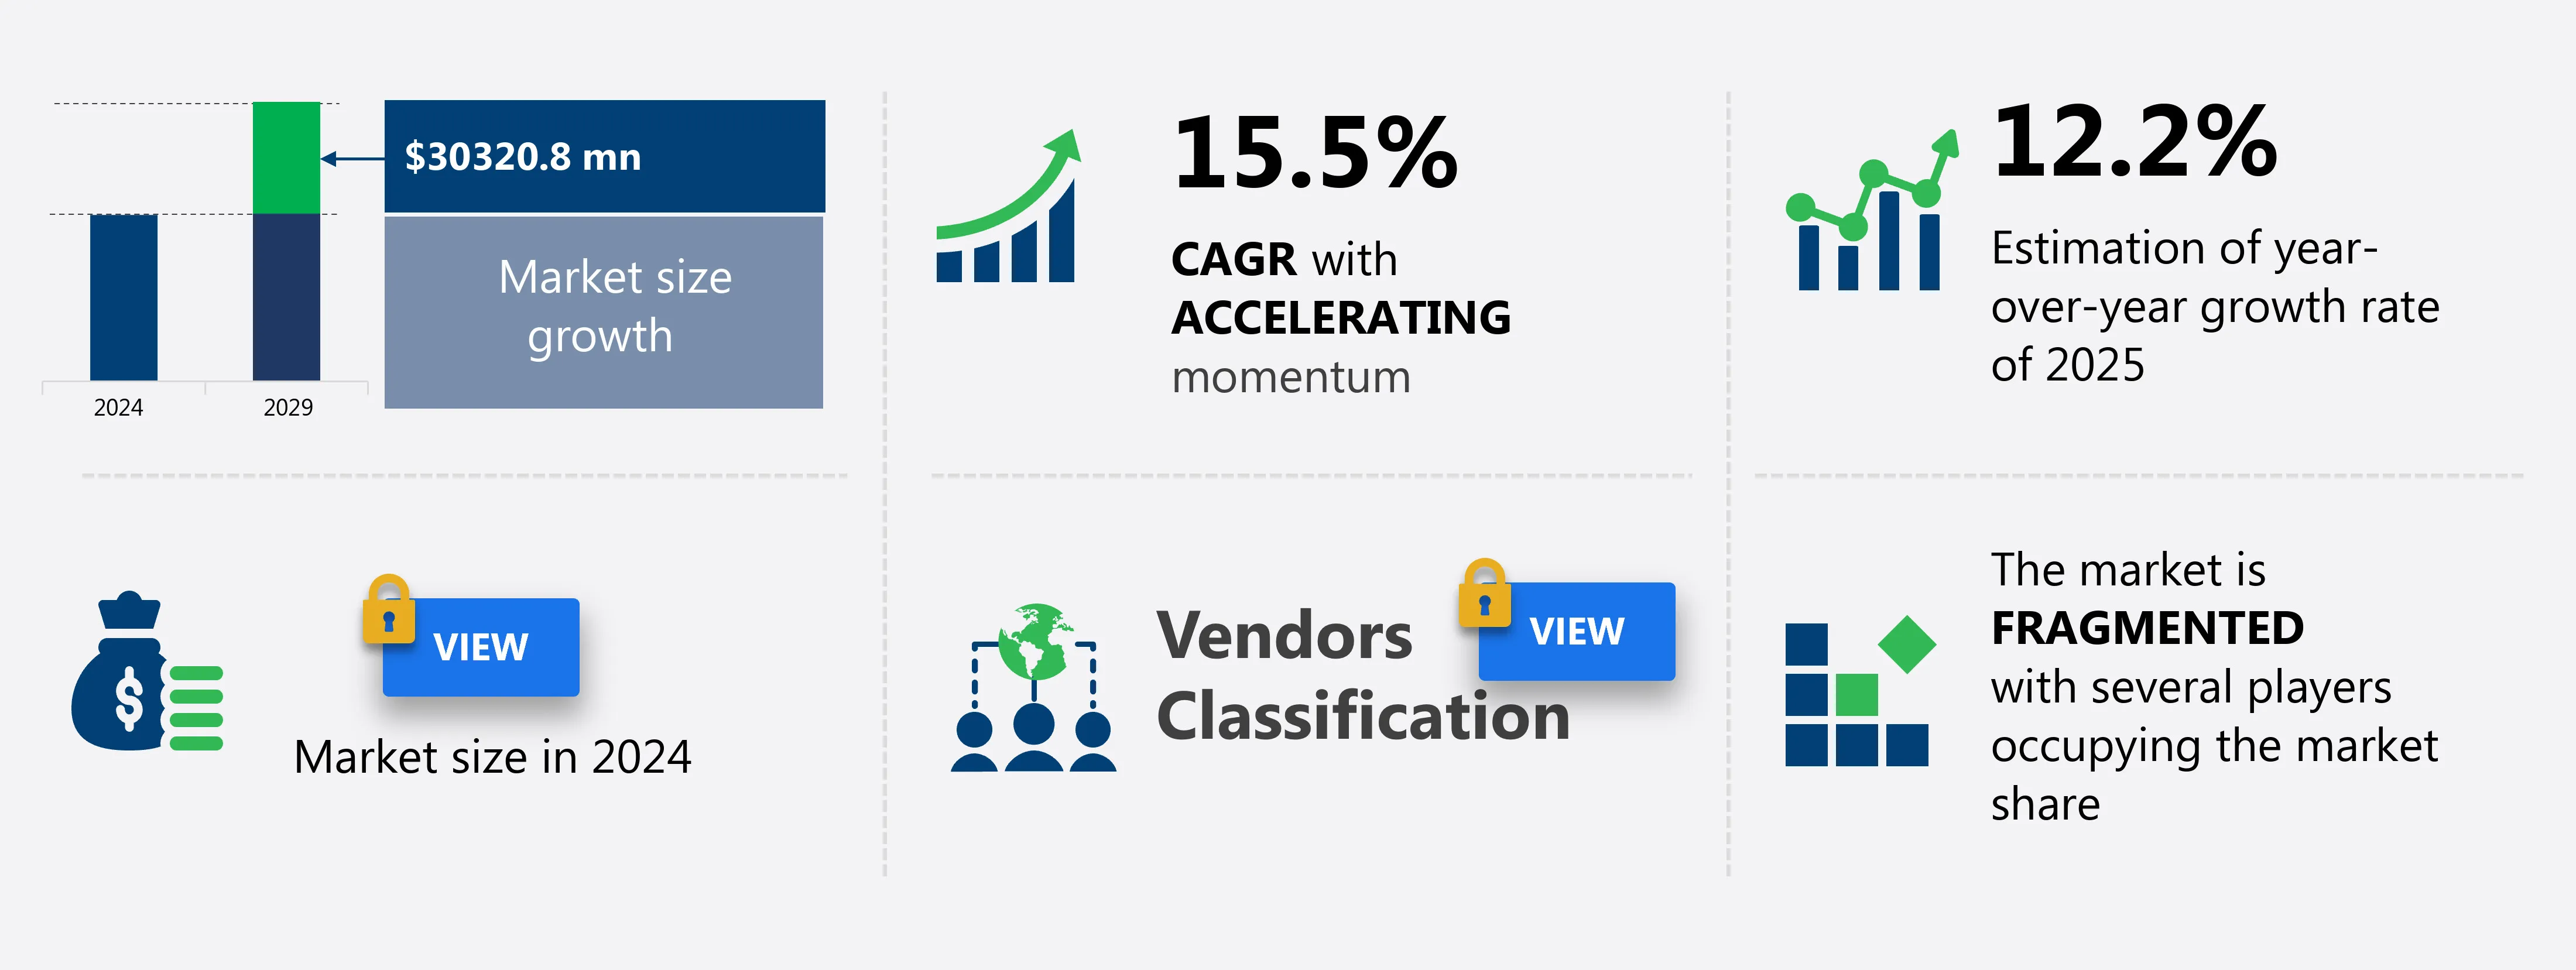
The India foundry market size is forecast to increase by USD 30.32 billion at a CAGR of 15.5% between 2024 and 2029.
- The foundry market is experiencing significant growth, driven by the increasing focus on technology upgrades, particularly the integration of Artificial Intelligence (AI) in foundry design processes. This technological advancement enables improved efficiency, productivity, and cost savings for manufacturers. This industry serves diverse sectors, including construction, aerospace, electronics, and industrial machinery. Moreover, environmental concerns are leading to increased environmental costs, pushing the market towards the adoption of more sustainable practices. These trends are shaping the foundry industry landscape and are expected to continue influencing market growth In the coming years. Additionally, the implementation of stringent regulations to reduce emissions and improve energy efficiency is further propelling the market forward. Overall, these factors present both opportunities and challenges for market participants, requiring them to stay abreast of the latest technological advancements and regulatory requirements to remain competitive.
What will be the Size of the market During the Forecast Period?
Request Free Sample
1 Executive Summary
- 1.1 Market overview
- Executive Summary - Chart on Market Overview
- Executive Summary - Data Table on Market Overview
- Executive Summary - Chart on Country Market Characteristics
- Executive Summary - Chart on Market Segmentation by End-user
- Executive Summary - Chart on Market Segmentation by Type
- Executive Summary - Chart on Market Segmentation by Material
- Executive Summary - Chart on Company Market Positioning
2 Technavio Analysis
- 2.1 Analysis of price sensitivity, lifecycle, customer purchase basket, adoption rates, and purchase criteria
- Analysis of price sensitivity, lifecycle, customer purchase basket, adoption rates, and purchase criteria
- 2.2 Criticality of inputs and Factors of differentiation
- Overview on criticality of inputs and factors of differentiation
- 2.3 Factors of disruption
- Overview on factors of disruption
- 2.4 Impact of drivers and challenges
- Impact of drivers and challenges in 2024 and 2029
3 Market Landscape
- 3.1 Market ecosystem
- Parent Market
- Data Table on - Parent Market
- 3.2 Market characteristics
- Market characteristics analysis
4 Market Sizing
- 4.1 Market definition
- Offerings of companies included in the market definition
- 4.2 Market segment analysis
- 4.4 Market outlook: Forecast for 2024-2029
- Chart on India - Market size and forecast 2024-2029 ($ million)
- Data Table on India - Market size and forecast 2024-2029 ($ million)
- Chart on India: Year-over-year growth 2024-2029 (%)
- Data Table on India: Year-over-year growth 2024-2029 (%)
5 Historic Market Size
- 5.1 Foundry Market in India 2019 - 2023
- Historic Market Size - Data Table on Foundry Market in India 2019 - 2023 ($ million)
- 5.2 End-user segment analysis 2019 - 2023
- Historic Market Size - End-user Segment 2019 - 2023 ($ million)
- 5.3 Type segment analysis 2019 - 2023
- Historic Market Size - Type Segment 2019 - 2023 ($ million)
- 5.4 Material segment analysis 2019 - 2023
- Historic Market Size - Material Segment 2019 - 2023 ($ million)
6 Qualitative Analysis
- 6.1 Impact of AI on Foundry Market in India
7 Five Forces Analysis
- 7.1 Five forces summary
- Five forces analysis - Comparison between 2024 and 2029
- 7.2 Bargaining power of buyers
- Bargaining power of buyers - Impact of key factors 2024 and 2029
- 7.3 Bargaining power of suppliers
- Bargaining power of suppliers - Impact of key factors in 2024 and 2029
- 7.4 Threat of new entrants
- Threat of new entrants - Impact of key factors in 2024 and 2029
- 7.5 Threat of substitutes
- Threat of substitutes - Impact of key factors in 2024 and 2029
- 7.6 Threat of rivalry
- Threat of rivalry - Impact of key factors in 2024 and 2029
- 7.7 Market condition
- Chart on Market condition - Five forces 2024 and 2029
8 Market Segmentation by End-user
- 8.1 Market segments
- Chart on End-user - Market share 2024-2029 (%)
- Data Table on End-user - Market share 2024-2029 (%)
- 8.2 Comparison by End-user
- Chart on Comparison by End-user
- Data Table on Comparison by End-user
- 8.3 Automotive - Market size and forecast 2024-2029
- Chart on Automotive - Market size and forecast 2024-2029 ($ million)
- Data Table on Automotive - Market size and forecast 2024-2029 ($ million)
- Chart on Automotive - Year-over-year growth 2024-2029 (%)
- Data Table on Automotive - Year-over-year growth 2024-2029 (%)
- 8.4 Electrical and construction - Market size and forecast 2024-2029
- Chart on Electrical and construction - Market size and forecast 2024-2029 ($ million)
- Data Table on Electrical and construction - Market size and forecast 2024-2029 ($ million)
- Chart on Electrical and construction - Year-over-year growth 2024-2029 (%)
- Data Table on Electrical and construction - Year-over-year growth 2024-2029 (%)
- 8.5 Industrial machinery - Market size and forecast 2024-2029
- Chart on Industrial machinery - Market size and forecast 2024-2029 ($ million)
- Data Table on Industrial machinery - Market size and forecast 2024-2029 ($ million)
- Chart on Industrial machinery - Year-over-year growth 2024-2029 (%)
- Data Table on Industrial machinery - Year-over-year growth 2024-2029 (%)
- 8.6 Agriculture - Market size and forecast 2024-2029
- Chart on Agriculture - Market size and forecast 2024-2029 ($ million)
- Data Table on Agriculture - Market size and forecast 2024-2029 ($ million)
- Chart on Agriculture - Year-over-year growth 2024-2029 (%)
- Data Table on Agriculture - Year-over-year growth 2024-2029 (%)
- 8.7 Others - Market size and forecast 2024-2029
- Chart on Others - Market size and forecast 2024-2029 ($ million)
- Data Table on Others - Market size and forecast 2024-2029 ($ million)
- Chart on Others - Year-over-year growth 2024-2029 (%)
- Data Table on Others - Year-over-year growth 2024-2029 (%)
- 8.8 Market opportunity by End-user
- Market opportunity by End-user ($ million)
- Data Table on Market opportunity by End-user ($ million)
9 Market Segmentation by Type
- 9.1 Market segments
- Chart on Type - Market share 2024-2029 (%)
- Data Table on Type - Market share 2024-2029 (%)
- 9.2 Comparison by Type
- Chart on Comparison by Type
- Data Table on Comparison by Type
- 9.3 Gray iron casting - Market size and forecast 2024-2029
- Chart on Gray iron casting - Market size and forecast 2024-2029 ($ million)
- Data Table on Gray iron casting - Market size and forecast 2024-2029 ($ million)
- Chart on Gray iron casting - Year-over-year growth 2024-2029 (%)
- Data Table on Gray iron casting - Year-over-year growth 2024-2029 (%)
- 9.4 Non-ferrous casting - Market size and forecast 2024-2029
- Chart on Non-ferrous casting - Market size and forecast 2024-2029 ($ million)
- Data Table on Non-ferrous casting - Market size and forecast 2024-2029 ($ million)
- Chart on Non-ferrous casting - Year-over-year growth 2024-2029 (%)
- Data Table on Non-ferrous casting - Year-over-year growth 2024-2029 (%)
- 9.5 Ductile iron casting - Market size and forecast 2024-2029
- Chart on Ductile iron casting - Market size and forecast 2024-2029 ($ million)
- Data Table on Ductile iron casting - Market size and forecast 2024-2029 ($ million)
- Chart on Ductile iron casting - Year-over-year growth 2024-2029 (%)
- Data Table on Ductile iron casting - Year-over-year growth 2024-2029 (%)
- 9.6 Steel casting - Market size and forecast 2024-2029
- Chart on Steel casting - Market size and forecast 2024-2029 ($ million)
- Data Table on Steel casting - Market size and forecast 2024-2029 ($ million)
- Chart on Steel casting - Year-over-year growth 2024-2029 (%)
- Data Table on Steel casting - Year-over-year growth 2024-2029 (%)
- 9.7 Malleable casting - Market size and forecast 2024-2029
- Chart on Malleable casting - Market size and forecast 2024-2029 ($ million)
- Data Table on Malleable casting - Market size and forecast 2024-2029 ($ million)
- Chart on Malleable casting - Year-over-year growth 2024-2029 (%)
- Data Table on Malleable casting - Year-over-year growth 2024-2029 (%)
- 9.8 Market opportunity by Type
- Market opportunity by Type ($ million)
- Data Table on Market opportunity by Type ($ million)
10 Market Segmentation by Material
- 10.1 Market segments
- Chart on Material - Market share 2024-2029 (%)
- Data Table on Material - Market share 2024-2029 (%)
- 10.2 Comparison by Material
- Chart on Comparison by Material
- Data Table on Comparison by Material
- 10.3 Ferrous - Market size and forecast 2024-2029
- Chart on Ferrous - Market size and forecast 2024-2029 ($ million)
- Data Table on Ferrous - Market size and forecast 2024-2029 ($ million)
- Chart on Ferrous - Year-over-year growth 2024-2029 (%)
- Data Table on Ferrous - Year-over-year growth 2024-2029 (%)
- 10.4 Non-ferrous - Market size and forecast 2024-2029
- Chart on Non-ferrous - Market size and forecast 2024-2029 ($ million)
- Data Table on Non-ferrous - Market size and forecast 2024-2029 ($ million)
- Chart on Non-ferrous - Year-over-year growth 2024-2029 (%)
- Data Table on Non-ferrous - Year-over-year growth 2024-2029 (%)
- 10.5 Market opportunity by Material
- Market opportunity by Material ($ million)
- Data Table on Market opportunity by Material ($ million)
11 Customer Landscape
- 11.1 Customer landscape overview
- Analysis of price sensitivity, lifecycle, customer purchase basket, adoption rates, and purchase criteria
12 Drivers, Challenges, and Opportunity/Restraints
- 12.3 Impact of drivers and challenges
- Impact of drivers and challenges in 2024 and 2029
- 12.4 Market opportunities/restraints
13 Competitive Landscape
- 13.2 Competitive Landscape
- Overview on criticality of inputs and factors of differentiation
- 13.3 Landscape disruption
- Overview on factors of disruption
- 13.4 Industry risks
- Impact of key risks on business
14 Competitive Analysis
- 14.2 Company ranking index
- 14.3 Market positioning of companies
- Matrix on companies position and classification
- 14.4 Aditya Birla Management Corp. Pvt. Ltd.
- Aditya Birla Management Corp. Pvt. Ltd. - Overview
- Aditya Birla Management Corp. Pvt. Ltd. - Product / Service
- Aditya Birla Management Corp. Pvt. Ltd. - Key news
- Aditya Birla Management Corp. Pvt. Ltd. - Key offerings
- SWOT
- 14.5 Ashok Iron Works P Ltd.
- Ashok Iron Works P Ltd. - Overview
- Ashok Iron Works P Ltd. - Product / Service
- Ashok Iron Works P Ltd. - Key offerings
- SWOT
- 14.6 Cooper Corp.
- Cooper Corp. - Overview
- Cooper Corp. - Product / Service
- Cooper Corp. - Key offerings
- SWOT
- 14.7 DCM Ltd.
- DCM Ltd. - Overview
- DCM Ltd. - Product / Service
- DCM Ltd. - Key offerings
- SWOT
- 14.8 Electrosteel Castings Ltd.
- Electrosteel Castings Ltd. - Overview
- Electrosteel Castings Ltd. - Product / Service
- Electrosteel Castings Ltd. - Key offerings
- SWOT
- 14.9 Fortune Foundries Pvt. Ltd.
- Fortune Foundries Pvt. Ltd. - Overview
- Fortune Foundries Pvt. Ltd. - Product / Service
- Fortune Foundries Pvt. Ltd. - Key offerings
- SWOT
- 14.10 Hackforth Holding GmbH and Co. KG
- Hackforth Holding GmbH and Co. KG - Overview
- Hackforth Holding GmbH and Co. KG - Product / Service
- Hackforth Holding GmbH and Co. KG - Key offerings
- SWOT
- 14.11 Indoshell Mould Ltd.
- Indoshell Mould Ltd. - Overview
- Indoshell Mould Ltd. - Product / Service
- Indoshell Mould Ltd. - Key offerings
- SWOT
- 14.12 Jayaswal Neco Industries Ltd.
- Jayaswal Neco Industries Ltd. - Overview
- Jayaswal Neco Industries Ltd. - Business segments
- Jayaswal Neco Industries Ltd. - Key offerings
- Jayaswal Neco Industries Ltd. - Segment focus
- SWOT
- 14.13 JSW Holdings Ltd.
- JSW Holdings Ltd. - Overview
- JSW Holdings Ltd. - Product / Service
- JSW Holdings Ltd. - Key offerings
- SWOT
- 14.14 Kirloskar Ferrous Industries Ltd.
- Kirloskar Ferrous Industries Ltd. - Overview
- Kirloskar Ferrous Industries Ltd. - Business segments
- Kirloskar Ferrous Industries Ltd. - Key offerings
- Kirloskar Ferrous Industries Ltd. - Segment focus
- SWOT
- 14.15 Larsen and Toubro Ltd.
- Larsen and Toubro Ltd. - Overview
- Larsen and Toubro Ltd. - Business segments
- Larsen and Toubro Ltd. - Key news
- Larsen and Toubro Ltd. - Key offerings
- Larsen and Toubro Ltd. - Segment focus
- SWOT
- 14.16 Menon and Menod Ltd.
- Menon and Menod Ltd. - Overview
- Menon and Menod Ltd. - Product / Service
- Menon and Menod Ltd. - Key offerings
- SWOT
- 14.17 Nelcast Ltd.
- Nelcast Ltd. - Overview
- Nelcast Ltd. - Product / Service
- Nelcast Ltd. - Key offerings
- SWOT
- 14.18 The Sanmar Group
- The Sanmar Group - Overview
- The Sanmar Group - Product / Service
- The Sanmar Group - Key offerings
- SWOT
15 Appendix
- 15.2 Inclusions and exclusions checklist
- Inclusions checklist
- Exclusions checklist
- 15.3 Currency conversion rates for US$
- Currency conversion rates for US$
- 15.4 Research methodology
- 15.7 Validation techniques employed for market sizing
- Validation techniques employed for market sizing
- 15.9 360 degree market analysis
- 360 degree market analysis
- 15.10 List of abbreviations


