By Esha Pal, eInfochips, an Arrow company
Abstract
The fundamental of testing is to check if the binary response applied to the chip as an input matches the compared values at the output. If the response matches circuit will be considered as good. The quality of the chip depends, how thoroughly it is tested. In VLSI this is conquered by Automatic Test Equipment (ATE).
Several types of testing are involved in the final manufacturing of chips, for example, characterization, production, burn-in, etc. For production, the first test is known as wafer sort or probe which differentiates the good devices from the defective ones. Once good devices are identifies the wafer is cut, and good devices are packaged.
Nowadays, engineers are focusing more on testing, as device size/logic is becoming large. The designs are becoming complex with time and thus testing is becoming challenging in terms of time and cost both. To cater good yield, different test and vectors are provided by DFT engineers. In this entire process the failures across the chip while testing is analyzed and debugged such that we do not lose hold on the yield. In such cases the Shmoo plots found to be useful to get a quick idea on what could be the issue of failures and where to look for in setup for debugging further.
Introduction to Shmoo
With the advancement in technology, we have come down to 5nm technology node, but with this, the circuits are more prone to defects. Before the chip comes into the market, it goes through various tests. Some of them are continuity check, boundary scan chain test, ATPG test, Burn-in test, stress test, etc.
To make the chip ready for production, we need to provide different sets of patterns like chain, stuck at, transition, and IDDQ vectors and many more from our end to have confidence that it will justify the credibility of the product. For example, chain test will ensure the integrity of the chip; stuck at vectors check if any node is stuck to 0 or 1, likewise all vectors have their importance in cooperating towards the testing of a device.
IC testing is required to validate if the design is stable for all process corners and help to improve yield. When IC’s are produced in high volume, it is economically beneficial, and thus they must be validated beforehand.
Shmoo can prove to be a promising way to optimize design validation. For example, you are facing hold time violations, in that case by looking at the ATE logs we can’t predict could be the issue of failures, but by looking at the Shmoo plots we can definitely find the issue. Thus the experience gained from Shmooing can be utilized to optimize the process, design and final test program.
What is Shmoo?
Though the origin of Shmoo is unclear, it is referenced in a 1966 IEEE paper and some other references and manuals.
Going through these references, one may come across the name “Robert Huston”, who was credited for the invention of Shmoo. It was said that the plot takes the name from Shmoo, a fictional species created by ALCapp in the cartoon Li'l Abner. This cartoon came into the picture as it has a blob-like structure, which was very much similar to the volume enclosed by the Shmoo plots drawn against three independent variables, such as frequency, voltage, and temperature.
Shmoo plots play a vital role in debugging. These plots are helpful to nail down the electrical failures in a circuit under test. The patterns provided by DFT engineers are tested by the test-engineers under different process conditions and with varying combinations of voltages and frequencies. The results are then sent in the form of shoerror logs and Shmoo plots, which are then analyzed to find the root cause.
Silicon debug is the most challenging phase of a product. It is a phase that starts with an initial silicon testing and goes on until the mass production. The primary purpose of silicon debug is to find and fix the bugs before the chip is sent to the market.
There have been many advances in the verification of a chip, in terms of tools, simulators, debugging platforms, and methodologies.
Types of Shmoo
1. Normal Shmoo
This is also called as a well-behaved Shmoo. The normal Shmoo is plotted against voltage and frequency. For Fig.1.1, as we move right towards the X-axis, frequency increases, and it can be said that device is working at a higher frequency. Similarly, as we start moving upwards in Y-axis Voltage increases.
In the Fig1.1 the green portion is depicting the pass region while the red potion is depicting the failed region.
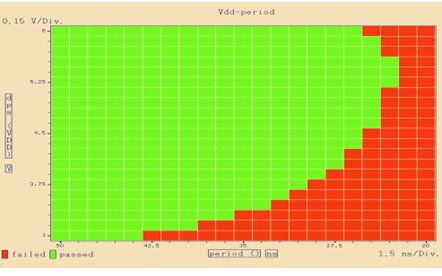
Fig.1.1 - Normal Shmoo
2. Brick wall Shmoo
Brick wall Shmoo depicts the bi-stable initialization problem of the chip. This occurs mainly if either first or the second time initialization goes randomly. For example, a register without a reset value defined for it may take any value 0 or 1 for initialization. Consider a scenario, when a device may fail at first, but it may get pass while testing the second time. So we can deduce that this might be because of one or more registers which might be causing the problem.
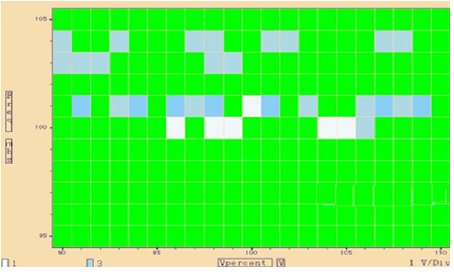
Fig.1.2.1 - Brick wall Shmoo
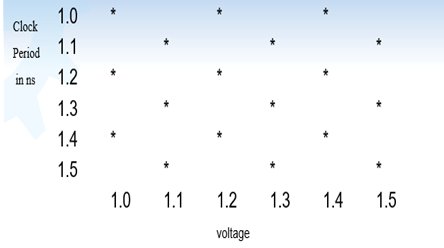
Fig.1.2.2 – Brick wall Shmoo
3. Wall Shmoo
Wall Shmoo depicts a failure at a certain voltage irrespective of any variation in frequency. This kind of Shmoo leads to indicate the problem of noise coupling, race condition, and charge sharing. The noise can be aggravated by higher di/dt (higher inductance) and dv/dt (higher capacitive coupling). Higher voltages mean circuit works faster which can lead to the problem of hold violation, i.e. latching data at incorrect time. Failures because of noise may also occur at very low temperatures as well as a very high temperatures depending upon the circuitry.
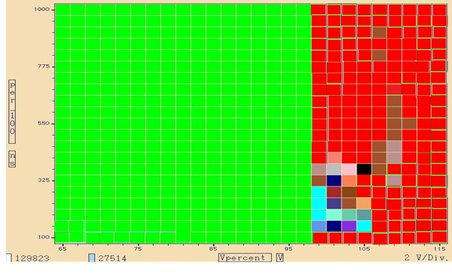
Fig.1.3.1 - Wall Shmoo
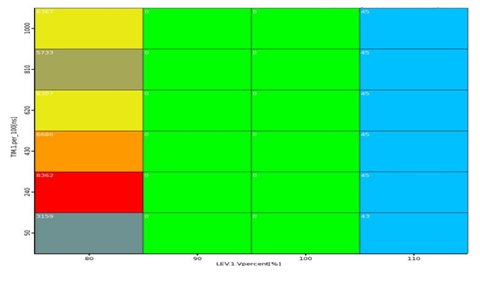
Fig.1.3.2 - Low voltage wall Shmoo
4. Reverse Speedpath
Reverse Speedpath Shmoo indicates the leakage of weak nodes before the end of the cycle. It depicts the Shmoo plot of how a circuit behaves with significant RC delay. Also, if the voltage is higher, then the leakage would also be more.

Fig.1.4.1 - Reverse Speedpath
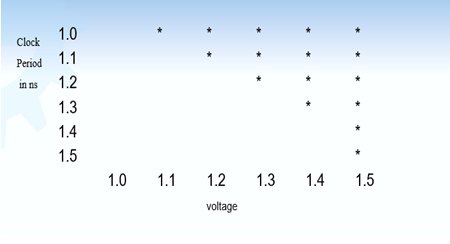
Fig.1.4.2 - Reverse Speedpath
5. Floor Shmoo
The Floor Shmoo represents a plot where the circuit works at high frequency but not at a lower frequency. It is also a variant of leakage problems, irrespective of voltage variation. At lower frequency, when leakage is present, and no other circuitry is active, circuits get enough time to leak. This also indicates timing issue. For higher temperatures, the leakage becomes more prone as heat increases subthreshold leakage in FET’s.
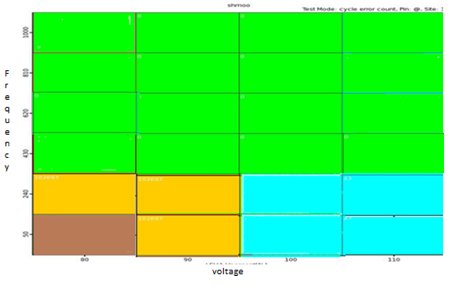
Fig.1.5.1 - Floor Shmoo
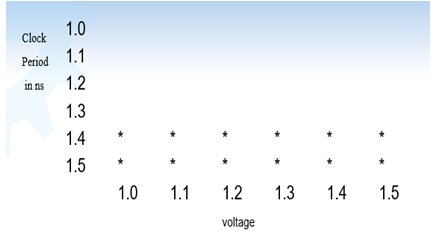
FIG.1.5.2 - Floor Shmoo
6. Finger Shmoo
Finger Shmoo represents the inductive and/or capacitive coupling. It indicates the problem in the alignment of aggressor and victim, where at specific frequencies and alignment, it always causes the failure.
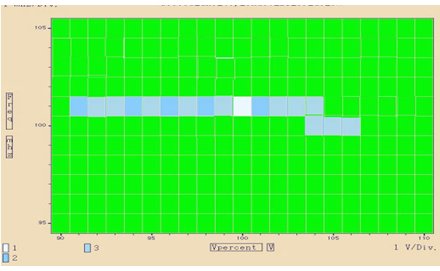
Fig.1.6.1 - Finger Shmoo
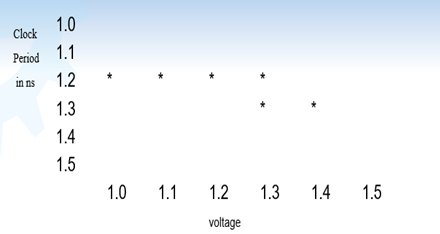
Fig.1.6.2 - Finger Shmoo
As the temperature increases, the transistor performance gets affected, and as a result resistance increases, which leads to the low frequency of operation. Same way as temperature decreases, the transistor performance improves, and hence resistance as well as leakage decreases.
Thus we should understand the fact that temperature plays a vital role in testing. Henceforth, the circuit should be tested and simulated at all process corners, i.e., fast -fast, slow- slow, and typical. It should be Shmoo’d at all different temperatures, voltage, and frequency.
Approach to Debug Scan Chain Failures
Follow below guidelines to debug scan chain failures
- For compressed designs, it is difficult to fetch out the failing flop, so make sure to have a bypass mode patterns ready such that failing flops can be quickly taken out.
- Give different pattern set such that it has all 0’s, all 1’s, 011111…, 100000…, 00110011, etc.
- Give quiet chain test vectors such that it has only one chain active at a time.
- Analyze the results received in the form of Shmoo error log, and this result will lead to the failing chain.
- Once-failing chain and failing flop information is handy, another necessary piece of data can be taken out, for example, which clock is driving these, what logic is sitting beside this, etc. and conclude the results.
Commonly Used Terminology of Testers
Marginality issue
The chip can fail at lower voltages or higher voltages, for this tester engineers can validate the same by changing the voltage and clock rate. To check the circuit’s robustness device is tested with 10% voltage vs 10% frequency variation. The Shmoo is taken at VDDL, VDDH, and VDDN, and then the clock rate is varied. So mainly for this check for PLL setup and IR drop, which could be the cause of these.

Fig.1.7.1- Showing marginality issue
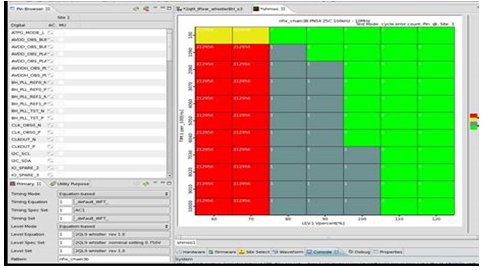
Fig.1.7.2 - Showing marginality issue
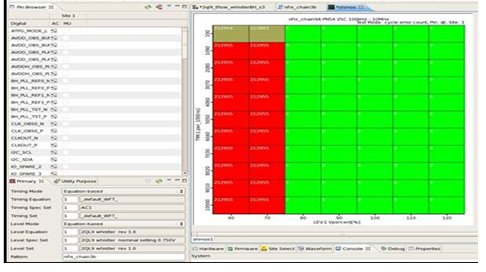
Fig.1.7.3 - Showing marginality issue
Power issue
As the technology is shrinking and scaling is done, an IC tends to consume more power than usual, it uses to consume, and as a result, the device dissipates more heat. Also Considering the tester time and reducing test time cost, a chip runs at high shift frequency. This can lead to problems such as high switching, and to avoid this problem power-aware ATPG and other new features are developed to have control over this issue.
Hold time
The hold time violations are unavoidable. This issue occurs irrespective of frequency. The hold time requirement states that the data inputs should remain stable for a sufficient period after the active clock edge. The main reason for hold time failures is crosstalk-induced, short paths, clock skew etc. To conquer this issue, find the failing flops and mask those flops, or else bypass them in the netlist and mask the flops which capture the hold violated flops data.
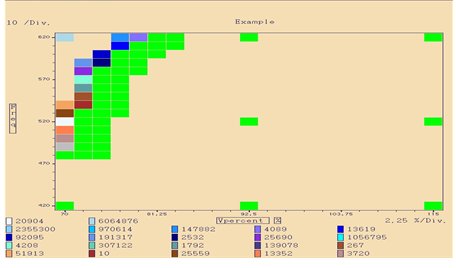
Fig.1.8.1 - Hold time issue

Fig.1.8.2 - Hold time issue
In below snapshots, I have tried to cover a few examples of different issues
Example 1: The below Shmoo plot (Fig.1.9) is for scan chain failing. It had the problem of improper Amplitude and hysteresis settings.
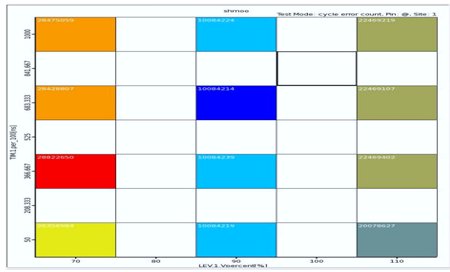
Fig.1.9 - Shmoo plot depicting failure because of improper amplitude and hysteresis settings.
Example 2: Here in FIG.1.10, only one color is there, which means that only one type of cycle is failing which also indicates that only one fault is present.
Fig.1.10 - Single-cycle failure
Example 3: Here in Fig.1.11 so many colors are there, which means that multiple cycles are failing.
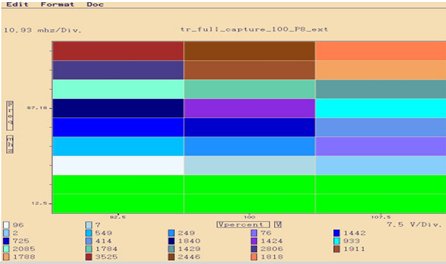
Fig.1.11 - Multiple cycle failure
Category of Shmoo
1. One-liner
This one-liner Shmoo represents the first fail and last pass per line and also shows an overall percentage of patterns failing at each parameter step.
2. Two-Dimensional
It shows pass and fails for two parameters when varied over a range. It is the most widely used plots for debugging silicon failures.
3. Three-Dimensional
It shows pass and fails for three parameters when varied over a range. These plots are not that much popular as compared to two-dimensional plots.
Conclusion
With technological advancement we have reduced the chip sizes drastically but which in turn generate many challenges for testing and debugging. Shmoo can help you solve the complex problems associated with design validation. Using Shmoo plots we can quickly find out the bugs and optimize the process, design and final test program.
Author:
Esha Pal
Esha Pal works as an ASIC DFT Engineer at eInfochips, an Arrow company. She has more than two years of experience in ASIC DFT, which includes working on various technology nodes, from 28nm to 7nm, handling a variety of DFT tasks.
References
- https://en.wikipedia.org/wiki/Post-silicon_validation
- https://en.wikipedia.org/wiki/Shmoo_plot
- https://ieeexplore.ieee.org/document/6912761
- http://www.ieee-tttc.org/?page_id=6934
- http://iccd.et.tudelft.nl/Proceedings/2004/22310192.pdf
- https://www.semiconductoronline.com/doc/Shmooplot-0001
- https://books.google.co.in/books?id=I9W2Uv3jY0UC&pg=PA543&lpg=PA543&dq=brick+wall+Shmoo&source=bl&ots=IQFaAgkf9a&sig=ACfU3U1Mmku5MejrrPCENke6kKAnJH-ZDA&hl=en&sa=X&ved=2ahUKEwjMoIbyqJPkAhUOqp4KHehiDfEQ6AEwEHoECAgQAQ#v=onepage&q=brick%20wall%20Shmoo&f=false
