
By Laxma Reddy Billa, Vatsal Viradiya (eInfochips)
Introduction
Computer vision has made significant advancements in recent years, particularly in the 3D domain. Generating a complete 3D scene is fundamental and pivotal in computer vision and robotics for tasks like surface reconstruction, augmented reality, and 3D scanning. In the logistics and distribution industry, there is a high demand for low-cost autonomous robots capable of 3D reconstruction of objects to measure volumetric dimensions.
At present, the accuracy of 3D scene reconstruction from 2D images is wanting. Depth sensors or cameras are capable of providing depth information, but depth cameras still offer a 2.5D description of a scene i.e. only a partial scene. This limitation arises because some portions of objects may be unmeasurable due to occlusions from the camera’s viewpoint. Capturing scenes or objects from different perspectives helps produce a complete 3D scene reconstruction.
In this blog post, we shall explore the methodology of 3D reconstruction on the multi-view object scenes, used for volumetric object dimensioning in autonomous robots. We shall also detail the steps of capturing data streams, generating object point clouds, reconstructing 3D point clouds through local and global registration algorithms, and calculating object dimensions in 3D. The results will be presented at the end.
Generate Data Streams
The RealSense depth camera is a highly integrated, low-cost option for autonomous robots and can be used in both indoor and outdoor scenarios. With an ideal measurement range of 0.6 to 6 meters, a wide field of view, global shutter technology, and a high-resolution RGB camera, it is a popular choice for developers and engineers working on advanced computer vision and robotics projects. RealSense can provide sparse point cloud data. Therefore, the RealSense D435 camera is used to capture data streams in this study. This camera can perform self-calibration via the RealSense SDK.
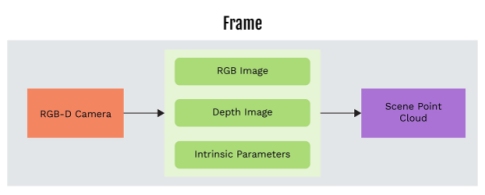
Figure 1: The block diagram presents the generating data streams
The RGB and depth images, along with the camera's intrinsic parameters, are captured from different viewpoints of the scene. The RGB and depth images are then aligned and time synchronized. The RGB-D point clouds are generated from the RGB and depth images, and camera intrinsic parameters.
Pre-process Point Clouds
The point cloud of the object of interest is obtained by segmenting the region of interest. Ensuring high quality and reliability of the point cloud is essential for achieving accurate registration with low computational cost. Therefore, noise reduction is performed using statistical methods. Threshold values for these methods are set based on the outlier density and the distance of outliers from the object point cloud. Finally, these point clouds provide a partial view of the object and are sparsely represented.
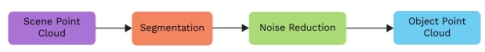
Figure 2: The block diagram presents the steps involved in pre-processing the point clouds
Point Clouds Registration and Object Reconstruction
Each frame of the point cloud is registered with the adjacent frame point cloud, leveraging their common features. For the pair-wise point cloud registration, a variant of the Iterative Closest Point (ICP) algorithm is implemented. The ICP registration is performed twice for each pair of point clouds: once for coarse correspondence search and once for fine correspondence search. For coarse correspondence search, down sample the point clouds to reduce computational load and use a broader search radius for finding correspondences. The ICP algorithm iteratively refines the transformation to minimize the distance between corresponding points in the t two-point clouds. For each iteration:
- Find the closet points between the two-point clouds.
- Estimate the rotational and translational matrixes that minimize the distance between these corresponding points.
- Apply this transformation to one of the point clouds.
- Repeat until the change in the transformation is below a threshold.
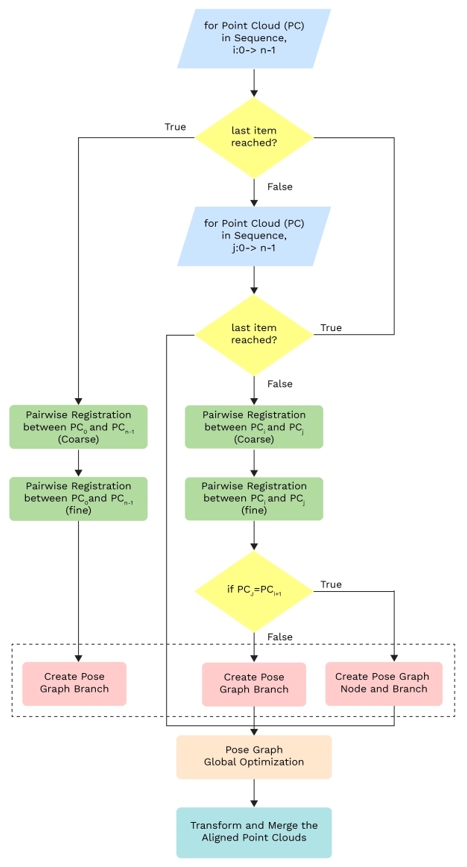
Figure 3: The operational flow diagram presents the point cloud registration process and fusion
After the pair-wise registration, the transformation between adjacent point clouds is used to build a pose graph. The pose graph represents the spatial relationship between the different viewpoints. Each node in the pose graph represents the position and orientation of a viewpoint. Each edge represents the transformation between the two viewpoints, obtained from the pairwise ICP registration. The global optimization technique is applied to minimize the overall error across the pose graph, ensuring that all point clouds are consistently aligned. Once the pose graph is optimized, all point clouds are transformed into a common coordinate system and merged.
Post-process Point Clouds
The merged point cloud is dense, and it may contain outliers and noise. The statistical method is applied to remove noise and outliers before performing voxel down sampling. This method requires the number of nearest neighbors to analyze and a standard deviation ratio to decide what constitutes an outlier.
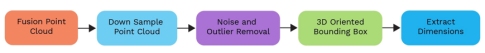
Figure 4: The block diagram presents the steps involved in post-processing the point clouds
The Principal Component Analysis (PCA) algorithm is implemented to determine the principal axes of the point cloud, aligns the point cloud along these axes, computes the axis-aligned bounding box in this new coordinate system, and then transforms it back to the original coordinate system. This method ensures an optimal fit for the bounding box around the point cloud, retrieves the dimensions (width, height, depth) of the bounding box, and calculates the volume by multiplying these dimensions.
Experimental Results
The experimental setup for this study is as follows. A cardboard box, measuring 45.5 cm in width, 46 cm in height, and 33 cm in depth, was selected as the object of interest. It was placed on a rotating platform, positioned 80 cm away from the camera. This arrangement allows the box to be rotated at specific angles, enabling the camera to capture images from different viewpoints and send them to a Nvidia Orin edge device.
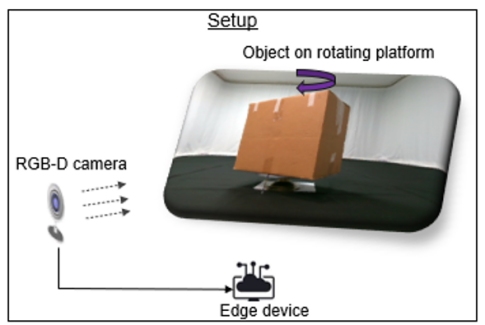
Figure 5: The diagram depicts experimental setup
The RGB and depth images, along with the camera's intrinsic parameters, are acquired for every 20° rotation of the object. These RGB and depth images are then aligned, and time synchronized.
Following the generation of the point clouds for the scene, the points representing the object are obtained by masking the region of interest. This initial object point cloud contains noise and outliers. Critical parameters for statistical methods applied to remove the noise and outliers were found to be 0.02m to 0.08m for nearest neighbors and 0.8 to 0.95 for the standard deviation ratio.
Then, voxel down-sampling of the object point cloud was performed to sufficient points to represent the shape and features of the captured object region, thereby reducing the computational requirements while maintaining accuracy. A voxel size of approximately 0.005m was chosen. Additionally, the point clouds were represented as tensors to leverage GPU architecture for faster computations during registration.
The corresponding distances are selected for the two levels of the IPC pairwise registration to achieve an accurate transformation matrix for aligned point cloud pairs. The first registration involves a coarse correspondence search between point cloud pairs, followed by a fine search in the second registration. Effective corresponding distances were found to be 10-13 times the voxel size for coarse ICP registration and 2-2.5 times the voxel size for fine ICP registration.
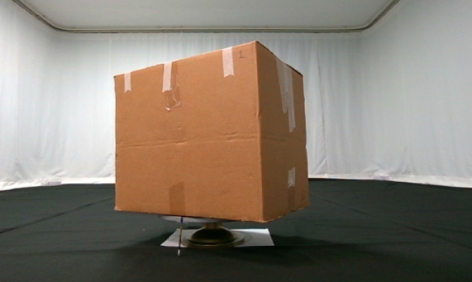
a)
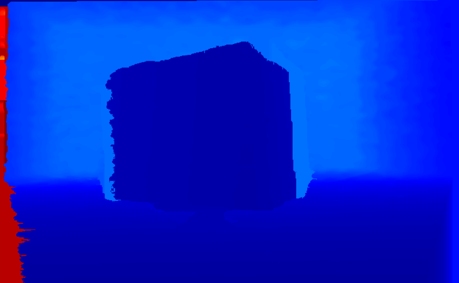
b)
c)
d)
e)
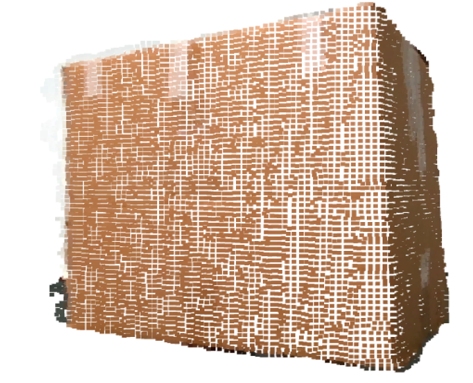
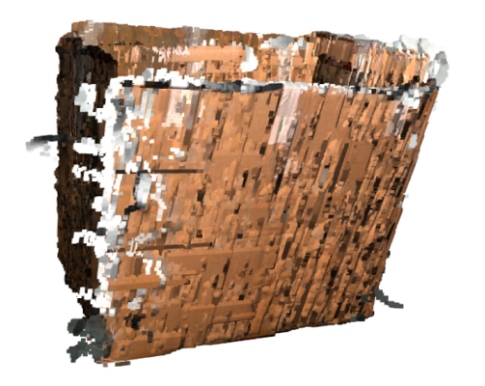
Figure 6: (a) RGB and (b) Depth images captured in a single frame, (c) Point cloud representation of the scene in the single frame, (d) Object-specific point cloud within the frame after pre-processing, and (e) Initial reconstructed point cloud prior to post-processing
After obtaining the transformations, such as translational and rotational matrices, from the pair-wise registration processes, the initial pose graph was constructed. Global optimization technique was then applied to minimize the overall error across the pose graph, ensuring consistent alignment of all the point clouds. Optimized transformations were applied to each point cloud to bring them into a common frame of reference. Subsequently, the aligned point clouds were merged to create a single, unified point cloud. As the unified or merged point cloud is dense, down sampling and statistical methods are applied to remove the outliers.
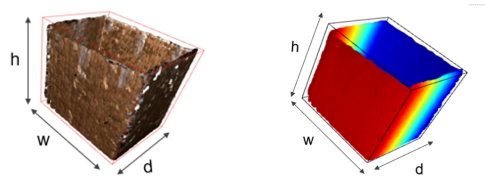
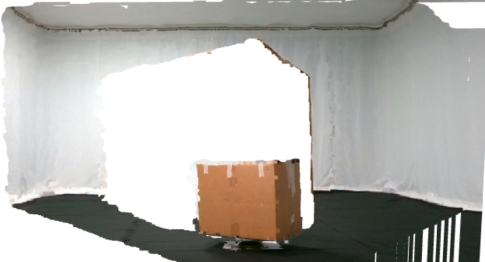
Figure 7: Surface-reconstructed object point clouds with oriented 3D bounding box after post-processing shown in both RGB-D (left) and Depth-only (right)
An oriented bounding box is obtained by applying the PCA algorithm, and volumetric dimensions of 47.47cm, 47.30cm, and 34.74cm are extracted. An accuracy exceeding 90% was attained across all three dimensions. The same pipeline discussed above is applied to process and reconstruct the depth-only point cloud, where no RGB components exist except depth map data (as shown in figure 7).
Conclusion
The 3D reconstruction of multi-view object scenes using the ICP algorithms and pose graph method is a powerful technique with wide-ranging applications in industries such as logistics and transportation. By combining multiple viewpoints, accurate alignment, and pose estimation, it is possible to obtain highly detailed and accurate 3D models of real-world objects. This methodology has the potential to revolutionize object dimensioning and shape analysis in autonomous robots, enhancing efficiency and cost-effectiveness in processes.
Authors:
Laxma Reddy Billa

Laxma Reddy Billa is currently working at eInfochips as AI Solutions Engineer where he works primarily on building AI/ML engines to support one of the company’s core products. Having contributed to projects in multiple countries in data science, he has a diverse skill set that seamlessly combines international perspectives with technical excellence. He received Ph. D degree from the University of south-eastern Norway, Norway. His expertise is Machine Learning, Natural Language Processing, 2D & 3D Computer Vision, edge computing, and building enterprise level AI-ML models, deployment, and testing.
Vatsal Viradiya

Vatsal Viradiya holds a bachelor's degree in electronic engineering and is currently working at eInfochips as an Embedded Engineer. Actively involved with both the Robotics and AI/ML teams, he is gaining experience in applying machine learning and computer vision techniques for autonomous robots and edge computing. He has working experience with programming languages such as C, C++, and Python.